
India’s artificial jewellery market (costume/fashion) is undergoing a structural transformation in the last few years. Historically, it was always treated as a low-cost, unorganized substitute for precious metals. But fashion jewellery has evolved into a standalone, design-led consumer discretionary sector.
Recent gold price volatility or rather sharp price fluctuations- urban workplace dynamics, higher disposable incomes, and hyper-responsive direct-to-consumer (D2C) supply chains, the industry is scaling from a fragmented wholesale trade into a branded, institutional asset class.
Executive Summary & Market Scale
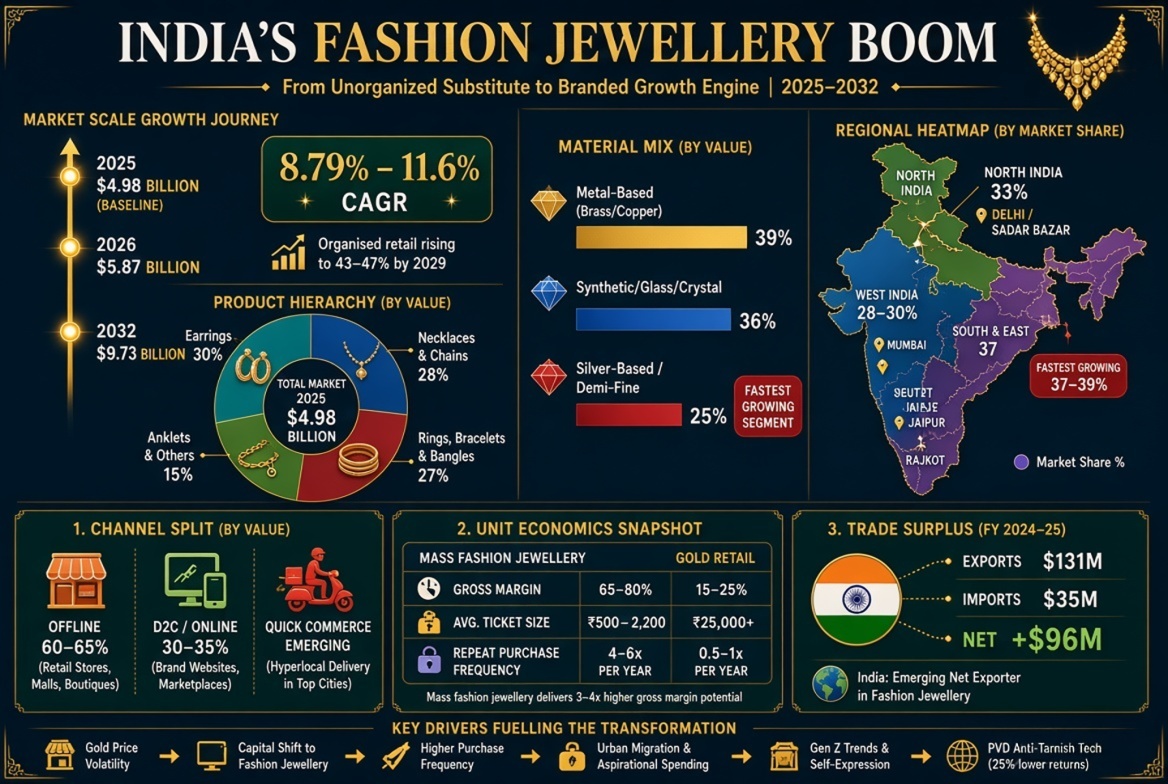
The Indian artificial jewellery sector is on the rise, outstripping several traditional lifestyle categories.
- Market Valuation: Valued at ₹47,051 crore (USD 4.98 billion) in 2025, the artificial jewellery market in India is projected to grow from ₹ 55,463 crore (USD 5.87 billion) in 2026 to ₹92,824.20 crore (USD 9.73 billion) by 2032.
- CAGR Trajectory: Market intelligence reports project a steady CAGR of 8.79% to 11.6% over the forecast period (varying by coverage scope between pure fashion costume and semi-precious/demi-fine segments).
- Market Composition Shift: Organised retail accounted for approximately 37% of the broader Indian jewellery market in CY 2024 (up from just ~2% in CY 2000 and ~30% in CY 2019). It is projected to reach 43%–47% by CY 2029, growing at a CAGR of 16%–18%. While the artificial jewellery sub-segment remains slightly more fragmented (with top organized players holding ~18% share), organized D2C and omnichannel brands represent the fastest-growing cohort.
[2025 Baseline: $4.98B] --------------> [2026 Projection: $5.87B] --------------------> [2032 Forecast: $9.73B]

                                    (CAGR: 8.79% - 11.6%)
This evolution is not a social media trend but is rooted in a fundamental redefinition of consumer utility. Customers are not looking at jewellery as an asset or generational wealth. Urban and Tier-2+ consumers treat fashion accessories as an extension of their own personality and fast-moving wardrobe extensions aligned with micro-fashion cycles and daily workplace wear. A similar trend is seen in organic food consumption in India.
Macro Drivers & The Gold Price Spillover Effect
The Gold Inflation & Capital Efficiency Shift
Increasing gold and silver bullion prices have squeezed consumer purchasing power. This means there is extra room for entry-level precious jewellery. As physical gold trades near historic highs, consumers gravitate toward affordable fashion alternatives crafted from base metals and cubic zirconia. Rather than committing significant working capital to traditional gold purchases, households are redirecting discretionary budgets toward high-grade imitation pieces (Kundan, Polki, cubic zirconia) and semi-precious demi-fine formats that replicate traditional aesthetics.
Gold Price Volatility --------> Squeezes Entry-Level Fine Jewellery Volumes
                                       ││
                                        ▼
                   Discretionary Capital Shift to Imitation/Fashion
                                       ││
                                        ▼
                  Higher Purchase Frequency & Cost-Per-Wear Optimization
Evolving Demographics & Micro-Trend Acceleration
- Workforce Integration & Migration: India's internal migration rate reached 28.9% in 2020-21. Higher migration toward urban centers combined with rising female labor force participation has expanded demand for modern, subtle, daily-wear accessories.
- Cost-Per-Wear Economics: Gen Z and Millennial demographics prioritize aesthetic variety, social media trends, and outfit matching over long-term asset holding. Annual purchase frequencies in urban markets average 4 to 6 transactions per consumer.
Material Innovation & Return Rate Impact
The technical transition away from base alloys (nickel/lead) toward skin-friendly 925 sterling silver, brass, and stainless steel has addressed historic pain points regarding skin sensitivity and tarnishing.
Product Technology Benchmark: Products utilizing PVD (Physical Vapor Deposition) anti-tarnish coatings demonstrate return rate reductions of up to 25% on e-commerce platforms, directly driving higher 90-day repeat purchase retention compared to standard electroplated options.
Product Breakdown & Regional Hubs
Product Hierarchy & Volume Share
Earrings maintain dominance across transaction volumes due to lower size constraints and daily wearability.
- Earrings:~30% market share (driven by hoops, studs, and daily office wear).
- Necklaces & Chains:~28% market share (valued as a key segment, driven by festive statement pieces and everyday layering).
- Rings, Bracelets & Bangles:~27% market share (fast-growing impulse purchase categories).
- Anklets, Toe Rings & Others:~15% market share.
Product Share Breakdown:
- Earrings (30%)
- Necklaces & Chains (28%)
- Rings, Bracelets & Bangles (27%)
- Anklets & Others (15%)
Base Metal Segmentation
- Metal-Based (Brass/Copper/Alloys): Accounts for ~39% revenue share, dominating mass-market and mid-tier fashion lines.
- Silver-Based / Demi-Fine: Comprises ~25% share, representing the fastest-growing bridge category.
- Synthetic, Glass, & Crystal: Holds ~36% share across fast-fashion and ethnic statement lines.
Regional Heatmap & Manufacturing Clusters
Consumption and production remain concentrated in key geographical hubs:
- North India: Holds the largest regional market share at ~33%, supported by high festive demand and major wholesale nodes like Sadar Bazar (Delhi).
- West India: Represents ~28%–30% of consumption and manufacturing, anchored by Mumbai (high-end cast alloy & Western trends), Jaipur (gemstones, Kundan, Meenakari), and Rajkot (imitation gold & antique finishes).
- South & East India: Account for the remaining ~37%–39%, with South India exhibiting rapid adoption of imitation temple jewellery.
Retail Economics, D2C, and Distribution Channels
Channel Distribution Split
While physical retail leads total volume, online and hyper-local channels are expanding rapidly:
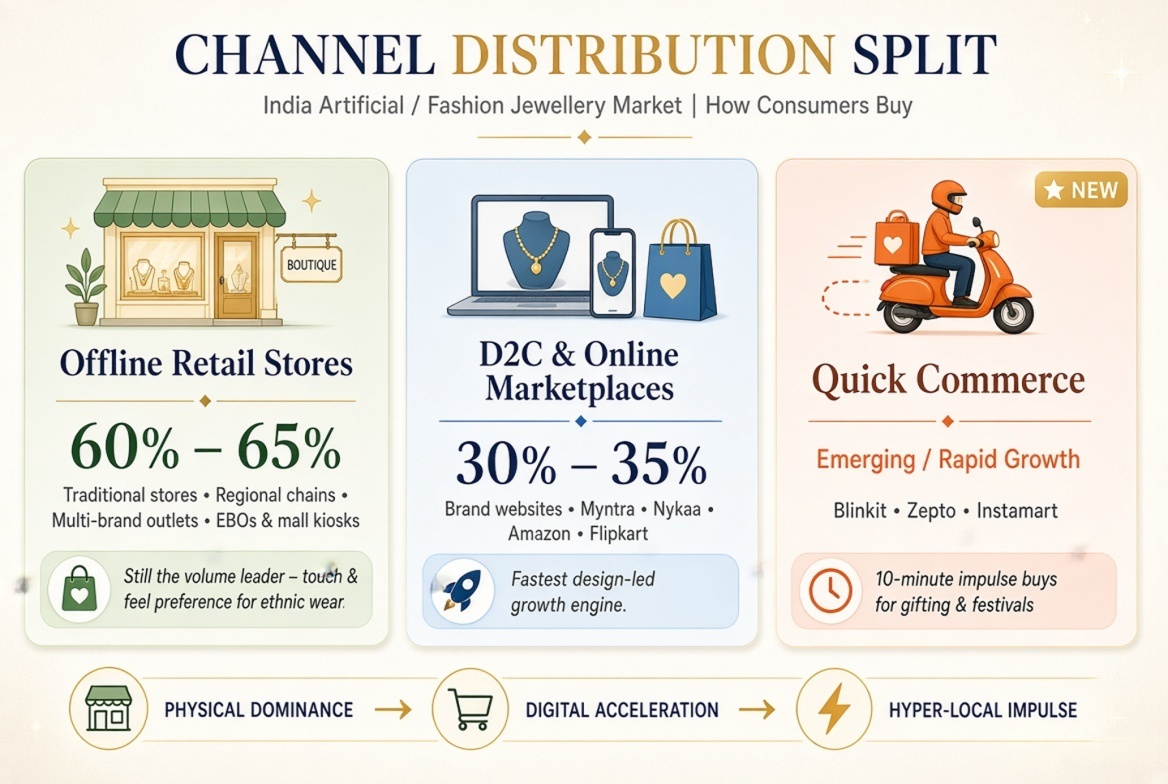
- Offline Retail (60%–65% Share): Traditional standalone stores, regional chains, and multi-brand outlets lead due to touch-and-feel preferences for heavy ethnic wear. Organized players are expanding physical footprints via Exclusive Brand Outlets (EBOs) and mall kiosks.
- D2C & Online Marketplaces (30%–35% Share): E-commerce platforms (Myntra, Nykaa, Amazon) and brand sites provide wide reach for design-led fashion lines.
- Quick Commerce Emergence: Hyper-local 10-minute delivery apps (Blinkit, Zepto, Instamart) are capturing impulse buying for last-minute gifting, festival accessorizing, and event purchasing.
Financial Economics Comparison
Fashion jewellery yields unit economics that contrast sharply with traditional bullion retail:
| Commercial Metric | Traditional Fine Gold Retail | Demi-Fine Jewellery (925 Silver/Plated) | Mass Fashion / Artificial Jewellery |
| Gross Margin % | 15% – 25% | 55% – 68% | 65% – 80% |
| Average Ticket Size (INR) | ₹30,000 – ₹150,000+ | ₹2,500 – ₹8,000 | ₹500 – ₹2,200 |
| Annual Repeat Rate | 1.2x – 1.5x | 2.5x – 3.2x | 4.0x – 6.0x |
| E-Com Return Rate | < 5% | 12% – 15% | 18% – 22% |
| Blended CAC Range (INR) | High (Trust-driven) | ₹400 – ₹750 | ₹200 – ₹450 |
| Primary Driver | Investment / Store of Value | Bridge Luxury / Daily Wear | Trend Matching / Affordability |
Competitive Landscape & Supply Chain Realities
Market Concentration & Brand Profiles
The market remains highly fragmented, with top organized players controlling ~18% of total revenue. However, venture-backed and scaled bootstrapped brands are consolidating Tier-1 and Tier-2 urban demand by offering plating warranties, branded packaging, and transparent pricing.
- Key Organized & D2C Players: Kushal’s Fashion Jewellery, GIVA, Palmonas, Rubans, Zaveri Pearls, Priyaasi, Voylla, Peora, Shining Diva, YouBella.
- Marketplace Channels: Nykaa Fashion, Myntra, Amazon India, Flipkart.
Market Share Split:
■ Organized Brands (~18%)
■ Unorganized Regional Retailers & Wholesalers (~82%)
Global Trade & Export-Import Balance
India maintains a net-positive trade balance in artificial jewellery, capitalizing on global demand for ethnic design work and cost-competitive manufacturing capabilities.
- Export Scale: India exported approximately ₹1,237.6 crore, or USD 131 million (~6.4 thousand metric tons) of artificial jewellery in 2025. Key export destinations include the United States, United Kingdom, UAE, France, and Spain.
- Import Dynamics: Imports totaled ₹330.05 crore, or USD 35 million (~674 metric tons) in 2025. Chinese imports account for approximately 50% of total imitation jewellery imports, primarily supplying low-cost components and synthetic stones.
- Net Trade Balance: India holds a positive net trade surplus of + ₹907.09 Crores (+$96 million) in the artificial jewellery category.
Supply Chain Friction Points
- E-Commerce Return Rates: Online return rates average 18%–22%, driven by color/plating expectations, sizing variances (rings/bangles), and transit damage.
- Input Volatility: B2B wholesale prices fluctuate with underlying raw metal costs (copper, brass) and imported component pricing.
- Design Protection: Unorganized manufacturers frequently replicate proprietary D2C designs within 3 to 6 weeks, accelerating price deflation across trending SKUs.
Strategic Outlook (2026–2030)
1. Accelerated Market Share Shift to “Demi-Fine” Segments
The boundaries between costume and precious jewellery will continue to blur. Anti-tarnish 18k gold-plated 925 sterling silver and high-grade brass will cannibalize traditional low-karat gold purchases, offering identical aesthetic value at a fraction of the cost.
2. Institutional M&A and Strategic Acquisitions
Major fine jewellery conglomerates (Titan Company, Kalyan Jewellers, Malabar Gold) are expected to acquire or launch dedicated fashion jewellery brands. These acquisitions will serve as lower-CAC customer acquisition funnels to capture younger consumers early in their lifestyle lifecycle.
3. Standardized Certifications & Regulatory Compliance
As urban consumers prioritize product safety, hypoallergenic (nickel-free, lead-free) standards and verifiable plating guarantees (1-to-2-year anti-tarnish warranties) will become critical differentiators for Tier-1 domestic retail and Western export compliance.
Key Cited References & Data Sources
- International Journal for Multidisciplinary Research (IJFMR)
- Publication: Jewellery Business in India: Opportunities & Challenges (Darshit Jain, Amity University)
- Scope: Microeconomic consumer shifts, internal migration patterns, gold inflation impact, and entry-level fine vs. costume jewellery volume dynamics.
- Link / Repository: IJFMR Article Directory
- Gem & Jewellery Export Promotion Council (GJEPC)
- Report: Gem & Jewellery Trade Trends Report (Ministry of Commerce & Industry, Government of India)
- Scope: Official national trade data bank, commodity-level import/export metrics (HS Code 7117 – Imitation Jewellery), export values ($131M export baseline), destination markets, and raw material imports.
- Link / Portal: GJEPC Official Trade Statistics
- Redseer Strategy Consultants
- Industry Report: Jewellery Market in India (Project Aurum) – Client Report for Bluestone Jewellery and Lifestyle Limited
- Scope: Market split between organized vs. unorganized sectors (CY 2000 to CY 2029 projections), channel dynamics, e-commerce penetration, and consumer demographic trends in urban India.
- Link / Report Portal: Redseer Strategy Insights
- IMARC Group Research
- Market Reports: India Costume Jewelry Market Size, Share, & Trends Report and India Jewellery Market Summary
- Scope: Product breakdown shares (earrings, necklaces, rings, bracelets), regional consumption heatmaps (North, West, South, East), base metal distributions, and offline vs. online channel splits.
- Link / Report Overview: IMARC Group – India Costume Jewelry Market
- Business Research Insights
- Market Research: Global & India Artificial Jewellery Market Outlook
- Scope: Multi-year baseline valuations, CAGR estimates (8.79%–11.6%), and material science adoption (PVD coatings, hypoallergenic brass, and 925 sterling silver).
- Link / Market Report: Business Research Insights – Artificial Jewellery Market