
India’s organic food industry has officially crossed the threshold from an urban wellness niche to a mainstream consumer default among middle-to-high-income households. Historically characterized by fragmented local farming networks and export-heavy cash cropping, the domestic ecosystem is undergoing structural realignments driven by shifting consumer preferences and modern retail infrastructure. A similar trend was noticed in our previous report on the artificial jewellery market in India.
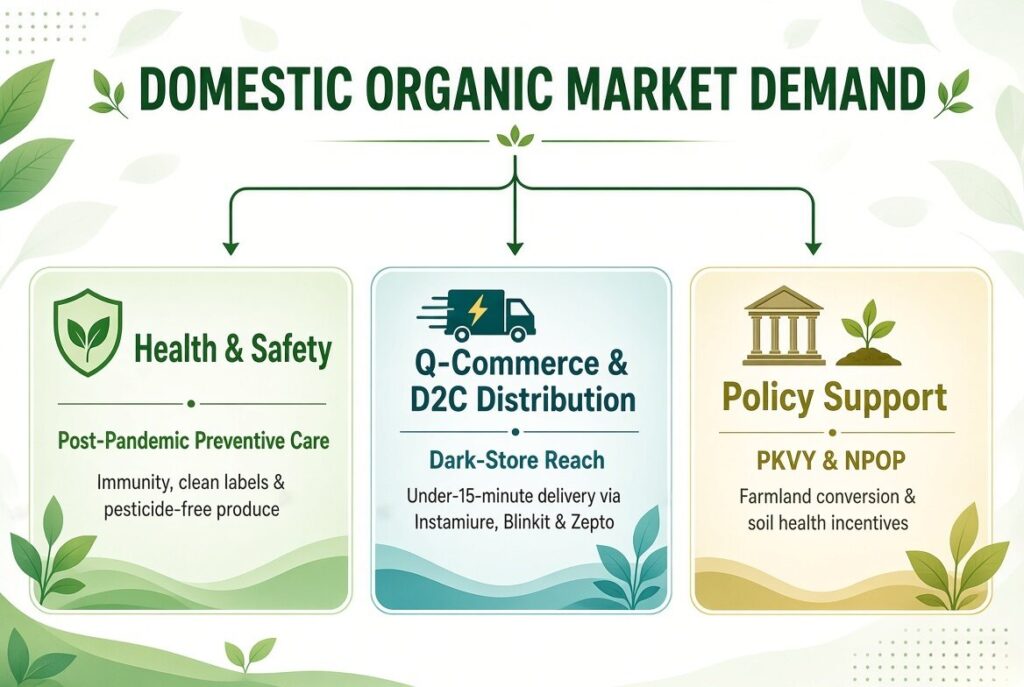
Three core macro drivers fuel this expansion:
- Preventive Healthcare & Post-Pandemic Shift: Urban consumers increasingly prioritize long-term immunity, clean labels, and pesticide-free produce over synthetic chemical farming outputs.
- Quick-Commerce (Q-Commerce) & D2C Proliferation: Platforms like Swiggy Instamart, Blinkit, and Zepto, alongside specialized D2C brand networks, have resolved historical distribution friction by reducing delivery times from days to under 15 minutes.
- Targeted Government Support: Institutional programs—including Paramparagat Krishi Vikas Yojana (PKVY) and the National Programme for Organic Production (NPOP)—continue to convert farmland and expand certified acreage.
2. Market Size, Growth Trajectory & Forecasts
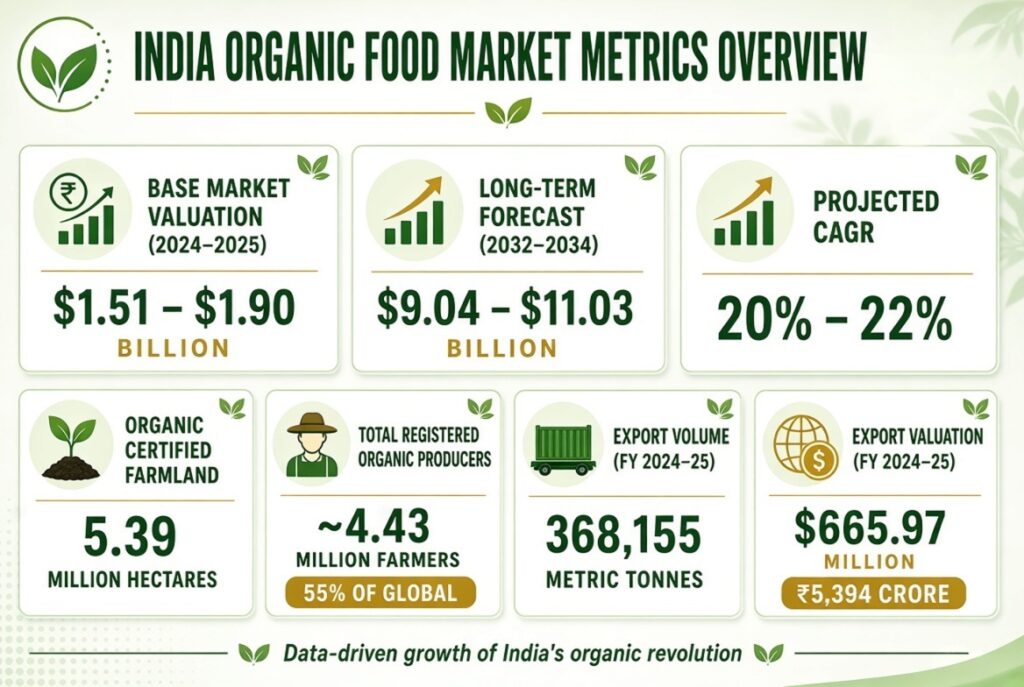
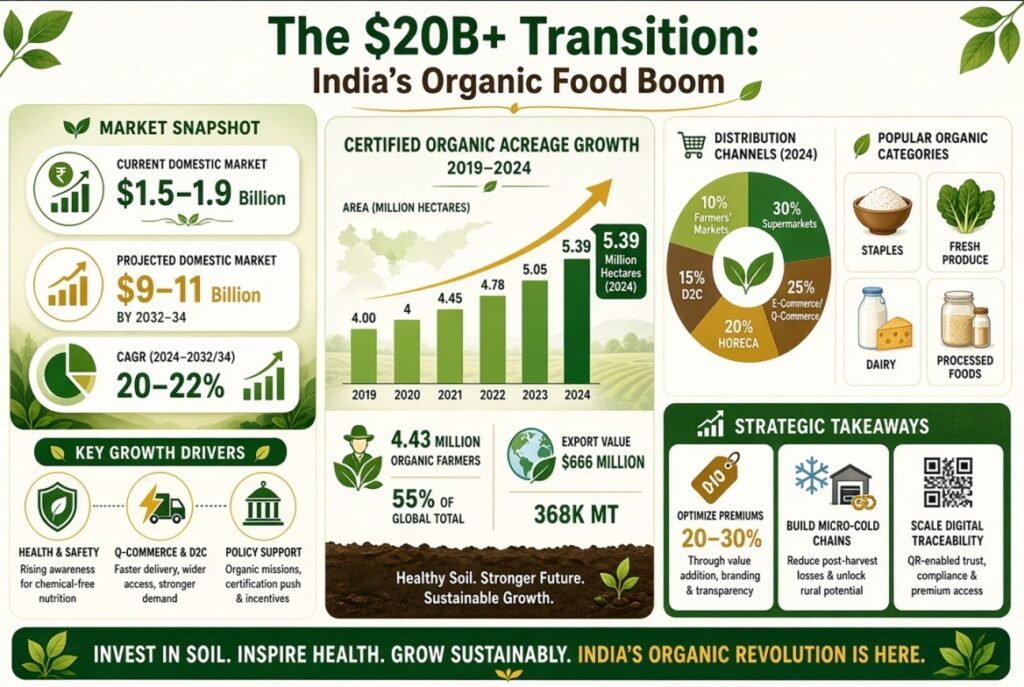
The domestic market for organic food in India is valued between ₹12,500 crore and ₹15,800 crore ($1.5 billion and $1.9 billion). Broad economic projections indicate a sustained compound annual growth rate (CAGR) of 20% to 22%, positioning the domestic industry to reach ₹75,000 crore to ₹91,700 crore ($9 billion to $11 billion) by 2032–2034.
Export vs. Domestic Dynamics
India generated $665.97 million (₹5,394 crore) in certified organic exports, representing 368,155 metric tonnes of shipped volume. Primary exports include oilseeds, processed cereals, tea, spices, and pulses. While exports historically accounted for the majority of organic revenue, the domestic segment is growing faster due to expanding urban purchasing power.
Agricultural Acreage and Producer Base
India ranks first globally in the number of organic producers, housing over 4.43 million registered organic farmers—representing approximately 55% of the global total. However, these producers make up just 2.8% of India's total farming population. Total certified organic land covers 5.39 million hectares (including wild harvest areas), representing roughly 1.5% to 2.8% of India's total cultivated agricultural land, leaving significant room for future land conversion.
  Certified Organic Acreage Trajectory (Million Hectares)

  2019-20  [■■■■■■■■■■■■■■■■■■■■] 4.00 Mha
  2020-21  [■■■■■■■■■■■■■■■■■■■■■■■] 4.55 Mha
  2021-22  [■■■■■■■■■■■■■■■■■■■■■■■■■] 4.97 Mha
  2022-23  [■■■■■■■■■■■■■■■■■■■■■■■■■■■] 5.23 Mha
  2023-24  [■■■■■■■■■■■■■■■■■■■■■■■■■■■■■] 5.39 Mha
(Data Source: National Centre for Organic and Natural Farming)
3. Key Market Segments & Revenue Drivers
Product Category Analysis
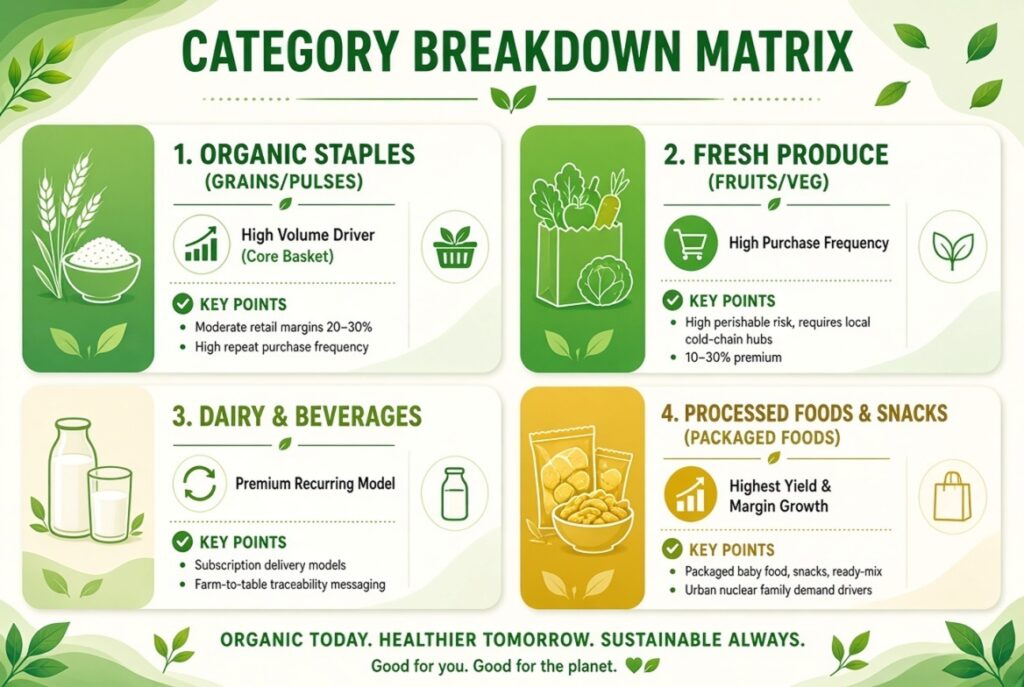
- Organic Staples (Grains, Pulses, Spices): Represents the largest volume share of domestic consumption. Consumers typically start their organic transition with daily cooking staples like tur dal, moong dal, and atta.
- Fresh Produce (Fruits & Vegetables): Shows the highest purchase frequency but faces shelf-life limitations. Micro-fulfillment hubs near metropolitan areas help mitigate waste.
- Organic Dairy & Beverages: Subscription models drive stable, recurring revenues for farm-fresh milk, ghee, and herbal teas.
- Processed & Convenience Foods: Fastest-growing yield segment. Busy urban households increasingly adopt organic baby food, packaged snacks, and ready-to-cook mixes.
Distribution Channel Dynamics
     Supermarkets & Modern Trade (30%)
     ██████████████████████████████
     E-Commerce & Q-Commerce (25%)
     ███████████████████████
     HORECA / Hotels & Rest. (20%)
     ██████████████████
     Direct-to-Consumer / D2C (15%)
     █████████████
     Farmers' Markets & Local (10%)
     █████████
(Channel Share Data Synthesis)
- Modern Trade & Supermarkets (30% Share): Anchor institutions like Nature’s Basket provide immediate brand visibility and trust for physical shelf placement.
- E-Commerce & Quick-Commerce (25% Share): The fastest-growing digital channel. Platforms like BigBasket and Swiggy Instamart leverage neighborhood dark stores to make organic products accessible on demand.
- Institutional & HORECA (20% Share): Premium hotels, restaurants, and catering operations increasingly mandate organic certification for sourcing.
- Direct-to-Consumer (D2C) & Farmers' Markets (25% Combined Share): Brand-owned channels foster community loyalty through farm tours, transparent sourcing data, and recurring subscriptions.
4. Supply Chain Infrastructure & Structural Bottlenecks
[ Farm / Farmer Clusters ] ──► [ Certification & Traceability ] ──► [ Processing & Cold Chain ] ──► [ Omnichannel Retail ]
Dual Certification Systems: Mechanics & Technical Trade-offs
India operates two primary regulatory certification pathways:
┌──────────────────────────────────────────────────────────────────────────────┐
│                    CERTIFICATION SYSTEM COMPARISON MATRIX                    │
├──────────────────────────────┬──────────────────────────────┬────────────────┤
│ Feature / Dimension          │ NPOP (Third-Party)           │ PGS-India      │
├──────────────────────────────┼──────────────────────────────┼────────────────┤
│ Primary Focus                │ Commercial Export & Retail   │ Smallholder    │
│                              │                    │ Domestic│
├──────────────────────────────┼──────────────────────────────┼────────────────┤
│ Regulatory Authority         │ APEDA / Ministry of Commerce │ NCOF / Agri    │
│                              │                    │ Ministry│
├──────────────────────────────┼──────────────────────────────┼────────────────┤
│ Verification Mechanism       │ Accredited 3rd-party agency  │ Peer review    │
│                              │ inspection[cite: 3]  │ group[cite: 3]│
├──────────────────────────────┼──────────────────────────────┼────────────────┤
│ Cost Overhead                │ High (₹30,000 – ₹100,000+)   │ Low to nominal │
├──────────────────────────────┼──────────────────────────────┼────────────────┤
│ Fraud Compliance Framework   │ Mandatory TraceNet tracking  │ Local group    │
│                              │[cite: 3]                    │ monitoring     │
└──────────────────────────────┴──────────────────────────────┴────────────────┘
The Food Safety and Standards Authority of India (FSSAI) enforces the Jaivik Bharat unified logo across both systems to confirm authenticity and prevent mislabeling in retail markets.
Real-World Field Findings: Organic Bottlenecks & Margin Pressures
Author observations across key organic farming clusters in Madhya Pradesh, Maharashtra, and Rajasthan reveal three persistent operational hurdles:
- Yield Drop During Conversion Periods: Farmers transitioning from conventional agriculture face a 20% to 35% reduction in output during the mandatory 3-year land conversion window. Without price premiums or subsidies during this transition phase, many smallholders return to chemical inputs.
- Cold-Chain Fragmentations and Perishable Loss: Up to 25% to 30% of fresh organic produce is lost between the farm gate and urban distribution centers due to a lack of refrigerated transport at rural collection points.
- Traceability Compliance Costs: While APEDA’s TraceNet system tracks export batches effectively, smaller D2C brands struggle with the administrative overhead of continuous lot-testing and residue analysis, which adds 3% to 5% to operational overhead.
5. Pricing Realities: Consumer Willingness vs. Retail Premium
A central challenge in scaling organic food in India is the gap between what consumers are willing to pay and actual market pricing.
┌─────────────────────────────────────────────────────────────────────────────┐
│             PRICING PREMIUM ANALYSIS ACROSS CORE COMMODITIES                │
├──────────────────────┬─────────────────────────┬────────────────────────────┤
│ Commodity            │ Reported Willingness    │ Observed Retail Premium    │
│                      │ to Pay (WTP)  │ Over Conventional│
├──────────────────────┼─────────────────────────┼────────────────────────────┤
│ Fresh Tomatoes (kg)  │ +20% to +30%            │ +65% to +70%               │
│ Organic Milk (Ltr)   │ +20% to +30%            │ +120% to +125%             │
│ Moong Dal (kg)       │ +20% to +30%            │ +45% to +50%               │
│ Tur/Arhar Dal (kg)   │ +20% to +30%            │ +30% to +80%               │
│ Wheat Dalia (kg)     │ +20% to +30%            │ +250% to +275%             │
└──────────────────────┴─────────────────────────┴────────────────────────────┘
  Price Premium Comparison: Consumer WTP vs Actual Retail Markups

  [Tur Dal]      WTP (+25%) [█████]
                 Retail Premium (+80%) [████████████████]

  [Organic Milk] WTP (+25%) [█████]
                 Retail Premium (+125%) [███████████████████████]

  [Wheat Dalia]  WTP (+25%) [█████]
                 Retail Premium (+275%) [█████████████████████████████████████████]
(Data Source: Synthesis of Willingness-to-Pay vs. Observed Retail Price Studies)
Market research shows consumer willingness-to-pay (WTP) typically peaks at a 20% to 30% premium over conventional food. However, actual retail prices for packaged staples and specialty goods can be 50% to 275% higher. Bridging this gap through efficient aggregation and streamlined distribution is critical for mass-market adoption[cite: 4].
6. Competitive Landscape & Market Dynamics
┌─────────────────────────────────────────────────────────────────────────────┐
│                  COMPETITIVE LANDSCAPE STRATEGY MATRIX                      │
├──────────────────┬─────────────────────────────┬────────────────────────────┤
│ Category         │ Representative Players      │ Strategic Playbook         │
├──────────────────┼─────────────────────────────┼────────────────────────────┤
│ Legacy Agri-     │ LT Foods (Nature Bio-Foods),│ Scale advantages; massive  │
│ Giants           │ Tata Consumer (Organic)     │ export infrastructure;     │
│                  │[cite: 5]                │ high capital access        │
├──────────────────┼─────────────────────────────┼────────────────────────────┤
│ Dedicated        │ Organic India, 24 Mantra,   │ Early mover brand equity;  │
│ Pure-Play        │ Organic Tattva, Sresta      │ wide retail distribution   │
│ Pioneers         │[cite: 5]                │ networks[cite: 1, 3]      │
├──────────────────┼─────────────────────────────┼────────────────────────────┤
│ New-Age D2C &    │ Country Delight, Organic    │ Direct subscription models;│
│ Agri-Tech        │ World, Conscious Food       │ farm transparency; dark-   │
│                  │[cite: 5]                │ store integration[cite: 3]│
└──────────────────┴─────────────────────────────┴────────────────────────────┘
Key developments reshaping the competitive landscape include:
- Venture Capital & Private Equity Inflows: Investment is shifting from basic farming projects toward tech-enabled supply chains, cold-chain logistics, and quick-commerce brands.
- Mergers and Acquisitions: Larger food conglomerates are acquiring specialized organic brands to gain immediate access to clean-label supply networks and certified farmer groups.
7. Regulatory Frameworks & Government Policy
The policy landscape in India combines promotional incentives with strict regulatory enforcement:
- Paramparagat Krishi Vikas Yojana (PKVY): Supports cluster-based organic farming by offering ₹25,000 per hectare over three years for organic inputs, manure, and regional processing infrastructure.
- Mission Organic Value Chain Development (MOVCDNER): Focuses on Northeastern states like Sikkim—India’s first 100% organic state—to build dedicated value chains for specialty exports like ginger, turmeric, and tea.
- Mutual Recognition Agreements (MRAs): APEDA actively negotiates bilateral MRAs with major trade partners. Bilateral agreements with Australia, Taiwan, and the European Union allow NPOP-certified products to enter partner markets without duplicate local inspections, reducing compliance costs for exporters.
8. Strategic Outlook & Key Takeaways for Business Leaders
To unlock market growth over the next decade, industry leaders, investors, and founders should prioritize three strategic imperatives:
┌─────────────────────────────────────────────────────────────────────────────┐
│                 STRATEGIC ROADMAP FOR INDUSTRY EXECUTIVE                    │
├──────────────────────────┬──────────────────────────────────────────────────┤
│ Strategic Focus Area     │ Actionable Implementation Mandate                │
├──────────────────────────┼──────────────────────────────────────────────────┤
│ Premium Optimization     │ Target retail premiums between 20% and 30% through│
│                          │ direct FPO sourcing and streamlined logistics[cite: 4]│
├──────────────────────────┼──────────────────────────────────────────────────┤
│ Supply Chain Logistics   │ Build micro-cold chain hubs near Tier-1 and      │
│                          │ Tier-2 urban clusters to cut post-harvest waste  │
├──────────────────────────┼──────────────────────────────────────────────────┤
│ Digital Traceability     │ Implement batch-level QR code verification on    │
│                          │ packaging to validate Jaivik Bharat compliance   │
│                          │ and build consumer trust[cite: 3]               │
└──────────────────────────┴──────────────────────────────────────────────────┘
- Optimize Retail Premiums: Standardize retail price markups closer to the 20%–30% threshold. Reducing retail markups helps bridge the gap between niche positioning and mass consumer adoption.
- Expand into Tier-2 and Tier-3 Cities: Growth in metropolitan areas provides a strong foundation, but rising disposable incomes in cities like Pune, Jaipur, Chandigarh, and Ahmedabad represent the next volume expansion frontier.
- Integrate Supply Chain Tech: Investing in digital farm management, real-time residue testing, and transparent batch tracking protects brand credibility, ensures compliance, and secures long-term market share.
References & Industry Sources
- APEDA (Agricultural and Processed Food Products Export Development Authority)
Ministry of Commerce & Industry, Government of India- Source Document:Indian Organic Sector Annual Report & Export Statistics[cite: 3, 4]
- Resource Link:APEDA Official Organic Portal[cite: 1]
- CEEW (Council on Energy, Environment and Water)
- Publication:Sustainable Agriculture in India: Organic Farming Systems & Cultivation Map
- Resource Link:CEEW Organic Farming Publication[cite: 2]
- Expert Market Research (EMR)
- Report:India Organic Food Market Outlook, Analysis, Growth & Industry Trends Forecast (2025–2034)
- Resource Link:EMR India Organic Food Market Report[cite: 6, 8]
- IMARC Group
- Report:India Organic Food Market Size, Growth & Forecast (2024–2033)
- Resource Link:IMARC Group Market Analysis[cite: 2, 8]
- Invest India
National Investment Promotion & Facilitation Agency- Publication:Exploring the Potential of India's Organic Food Market
- Resource Link:Invest India Sector Insights[cite: 2]
- National Centre for Organic and Natural Farming (NCONF)
Ministry of Agriculture & Farmers Welfare, Government of India- Report:Status of Organic Farming in India
- Resource Link:NCONF Official Portal[cite: 3]
- ResearchGate & Academic Repositories
- Publication:Organic Farming in India: Benefits, Consumer Willingness to Pay, and Value Chain Challenges
- Resource Link:ResearchGate Publication Portal[cite: 2]
- USDA Foreign Agricultural Service (FAS)
- Report:India: Organic Industry Market Report & Trade Opportunities
- Resource Link:USDA FAS International Reports[cite: 3, 8]
1 thought on “Organic Food Market Size in India”
Comments are closed.